1. 43,800 Years Ago – End of Wisconsin Ice Age
2. 29,000 Years Ago – Caspian Sea Pole
3. 18,500 Years Ago – Hudson Bay Shift
4. 11,500 Years Ago – Sudan Basin Shift
5. 7,000 Years Ago – Arctic Ocean Shift (Noah’s Flood)
• Cascadia Subduction Zone rupture, unleashing mega-tsunamis exceeding 100 m.
• Great Lakes region fractures, creating new inland seas.
• Eastern seaboard cities erased by crustal displacement, consistent with Hapgood’s models.
• Europe: Mediterranean basin disrupted; Alpine ranges uplift further.
• Asia: Himalayan orogeny intensifies; Siberian permafrost vanishes.
• SouthEast Asia: Uplift along Indochina (Laos tilting with the Himalayas). South China Sea drains, while Singapore, Malaysia, Indonesia, and southern Thailand subside beneath the ocean. ASEAN and Australian plates tilt into the temperate zone.
• Middle East: Extreme heat, tectonic fractures, urban collapse under sand burial.
• Africa: Rapid desertification, >100 m mega-tsunamis on coasts, continental rifting followed by partial inundation.
• Australia: Coastal submergence; continental interior becomes fertile. Plate shifts into temperate latitudes.
• Antarctica: Partial thaw, then rapid refreeze (flash-freeze artifacts?).
• Vegetation and human structures stripped. No standing forests. Lakes and rivers salinized.
• Gulf Stream collapse, abrupt cooling of temperate zones including new ASEAN & Australia
🔗 Science, Evidence, Logic, Solution:
🚀 Resilience, preparedness no longer optional, it's survival and rebirth:
totrade.co/s🤝 Multilateralism Enhanced and Inclusive Approach:
totrade.co/m
🌍 The Ongoing Quaternary Glacial-Interglacial Abrupt Cycle — Prelude to Cataclysm
The Pleistocene Epoch (Graph 2) was not a gradual Ice Age—it was a violently unstable era marked by abrupt glacial-interglacial transitions, collapsing ice sheets, and catastrophic environmental resets.
Before the relatively calm Holocene (~11,700 years ago), vast ice sheets covered much of the globe. Their melting was not always slow—many ended abruptly, triggering extinction-scale events.
🧊 Around 11,500 years ago, multiple global data points align:
* Sudden collapse of the Laurentian ice cap in Canada.
* Mass animal burials in Pejark Marsh, Australia.
* Destruction of Tiahuanaco civilization by violent flooding.
* Rapid planetary climate shift—possibly the origin of the "
Adam and Eve" cataclysm.
❗ Ice Ages Were Not Gentle
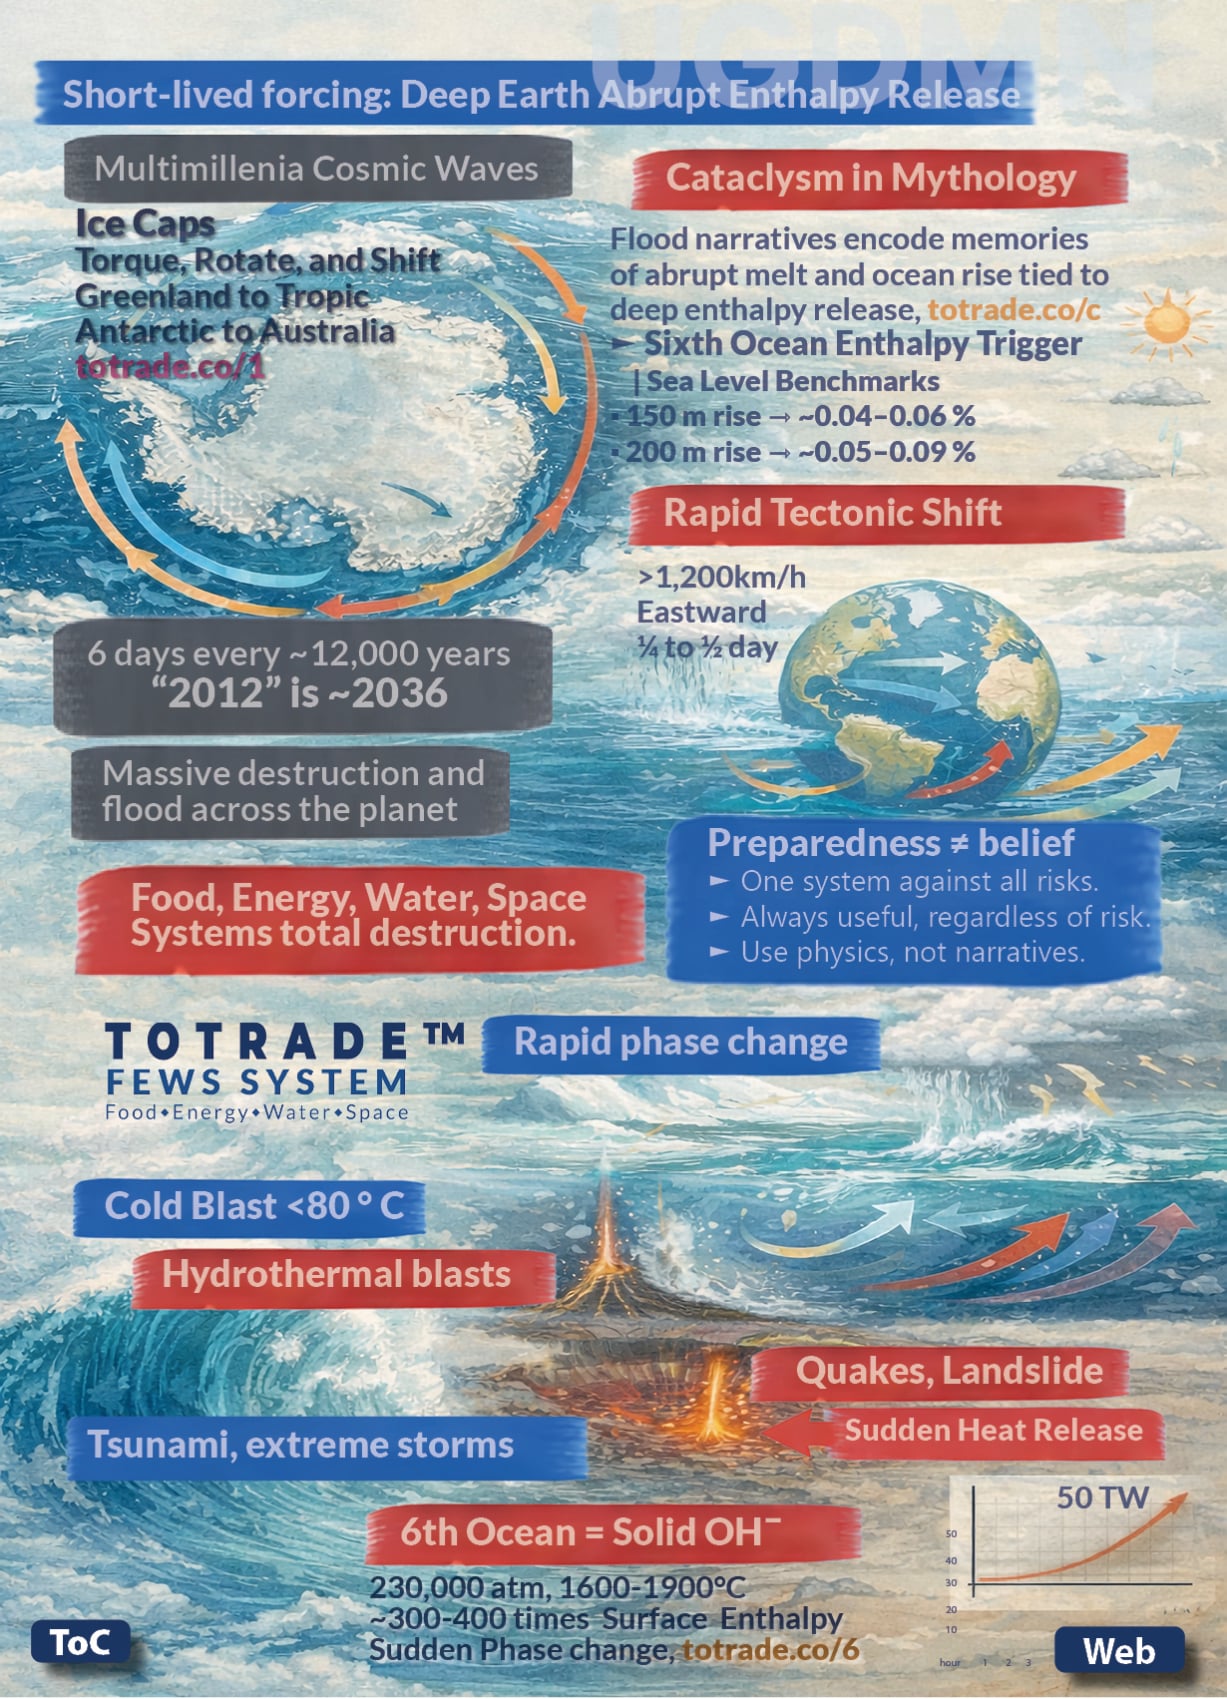
Ice Ages didn’t progress in a uniform manner. Hemispheres shifted poles rapidly. The Earth’s crust (lithosphere) rotated over the mantle, repositioning land masses.
The lithospheric shift occurs astonishingly fast—within 6 to 12 hours (¼ to ½ day). This rapid movement of the Earth's crust over the mantle drastically repositions the geographic poles, triggering catastrophic displacement of the crust, atmosphere, and oceans at supersonic speeds due to differential motion.
> ⚠️ The reverse also occurs:
> Tectonic plates shifting abruptly toward the poles face sudden and violent impact from super-cold stratospheric air plunging down to the surface.
> This hyper-chill effect causes instant flash-freezing, ecological shock, and regional devastation—evidence of which is found in frozen mammoths, flash-buried species, and fossilized food mid-chew.
📉 Climate Chaos and Extinctions (Graph 1 & Timeline)
Key mass extinction-linked transitions:
* 🧬 Cambrian Explosion (541 Mya): CO₂ ~7000 ppm.
* 🦖 Triassic-Jurassic (201 Mya): CO₂ ~2200 ppm, #GCRs surge, volcanic-triggered die-off.
* 🌡️ PETM (56 Mya): #GCRs surge, #Cataclysm triggered Rapid warming, ecosystem collapse.
* ❄️ Pliocene (2.6 Mya): #GCRs surge, #Cataclysm triggered #IceAge onset with CO₂ ~400 ppm.
* 🏛️ Holocene (11.7 kya – now): Civilization flourishes… temporarily, #GCRs is surging, #Cataclysm #Imminent, #RapidDying, triggering #Glacial Return, back to #StoneAge.
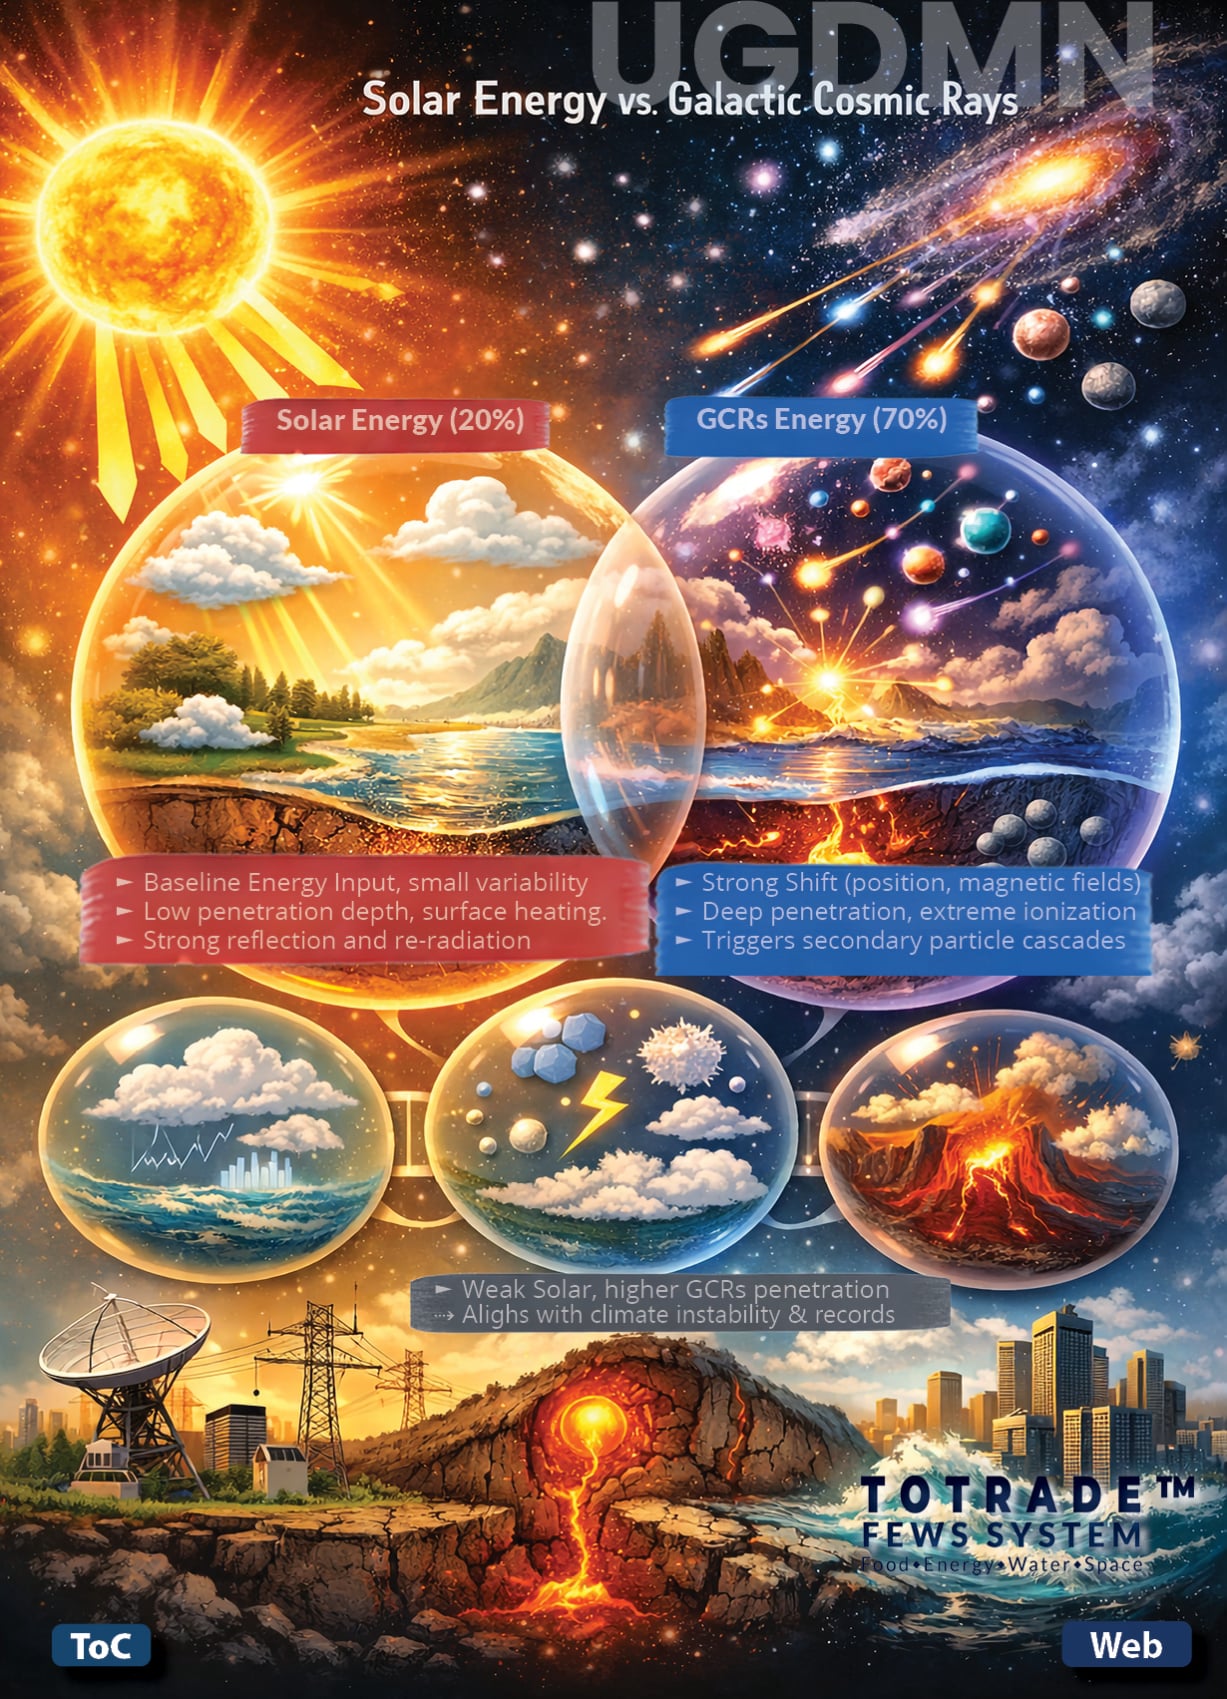
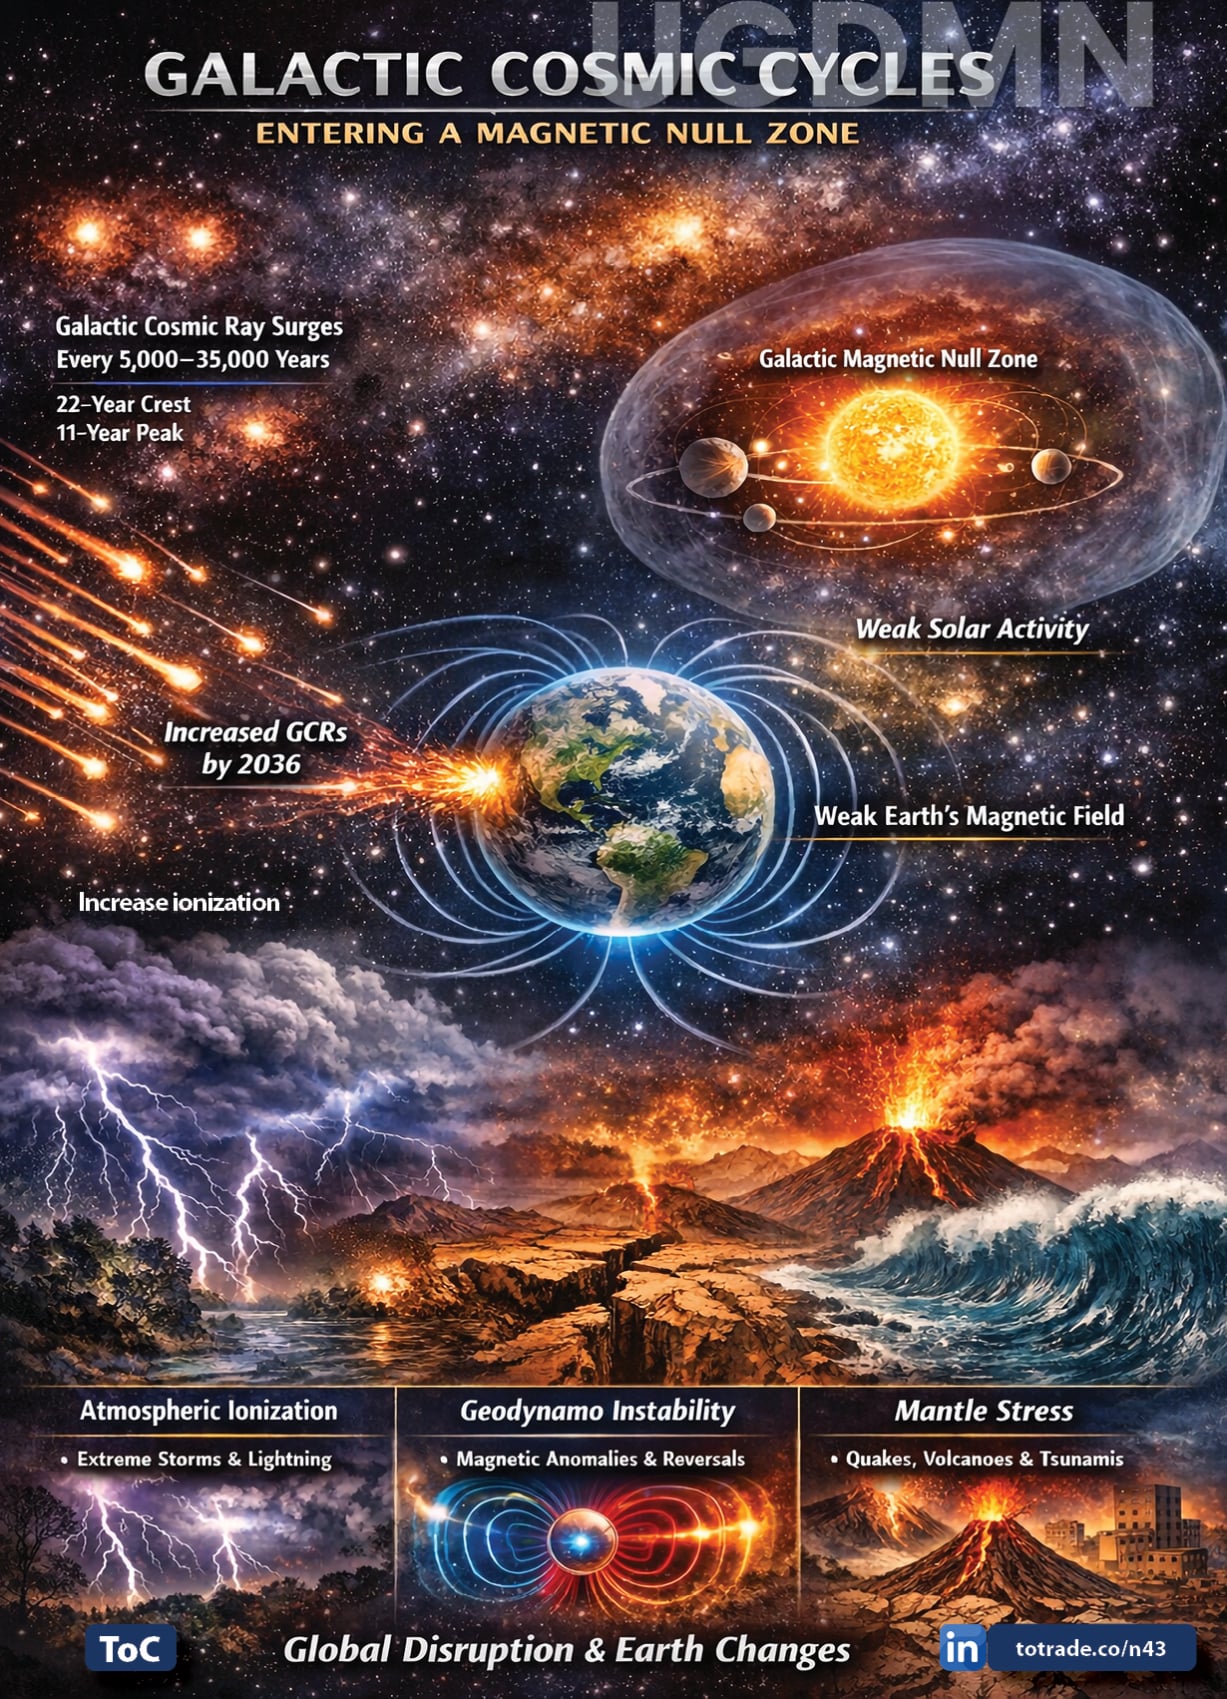
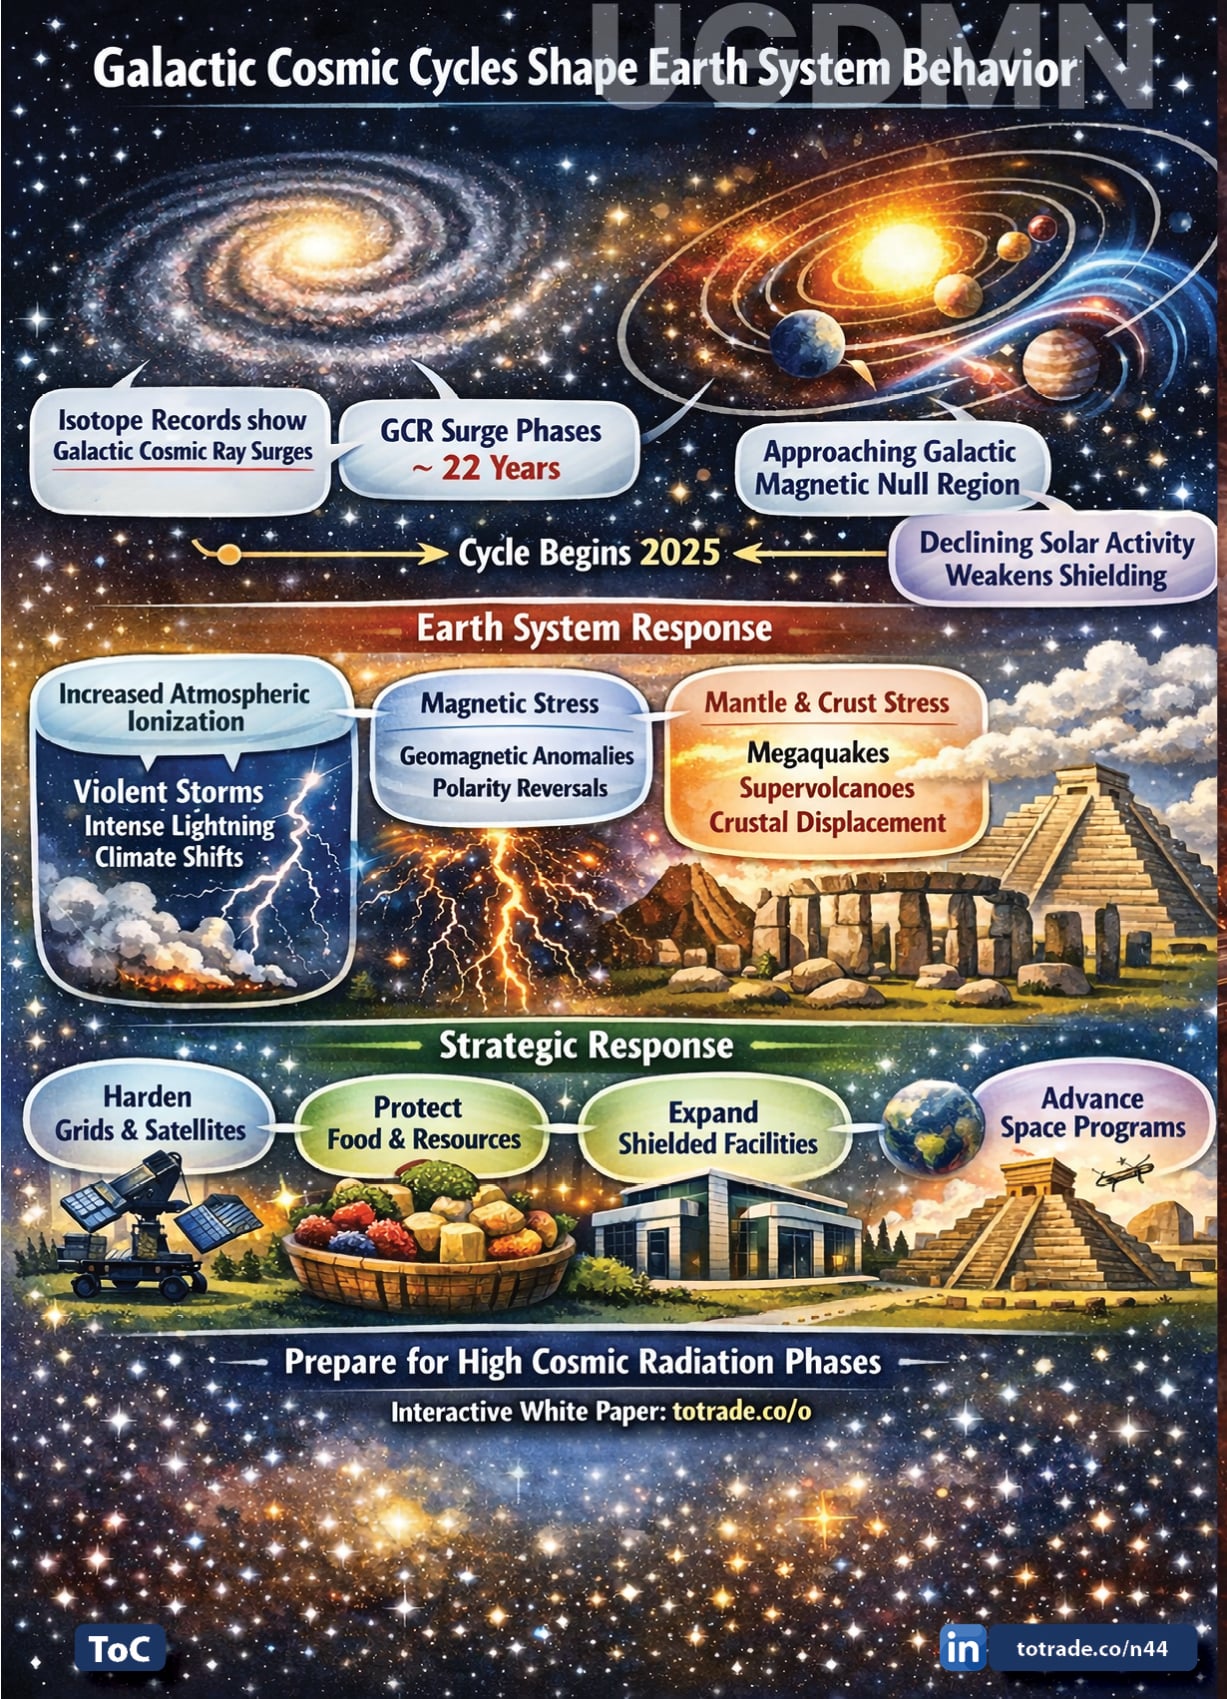
Yes now, we're entering a new cataclysmic phase:
☀️ Weak solar output,
totrade.co/sm | 🌌 High GCRs | ⬇️ Magnetic shield | 🔺 CO₂ spike by days of supervolcanic eruptions.
(See Graphs 3–6, esp. 1979–2025)
🛑 The Next Transition Approaches (Possibly ~2036)
Human civilization developed during an anomalous period of stability. That window is closing.
🔗 Explore scientific evidence & strategic responses:
=====LinkedIn Comment Version=====
The warmth we fear is also the source of life. History shows Earth’s climate has shifted between extremes, with CO2 and temperatures independently driving evolution and collapse:
• Cambrian (~541–485 Mya: ~7,000 ppm CO2, ≈20–25°C): life exploded, oceans filled with new species totrade.co/co2a • Triassic-Jurassic (~252–145 Mya: ~2,200 ppm,≈18–25°C): dinosaurs rose, mass extinctions followed
totrade.co/co2b• PETM (~56 Mya: ~1,800 ppm, ≈23–26°C): rapid warming, ecosystems reshaped
totrade.co/co2c• MMCO (~17–14 Mya: ~600 ppm, ≈18–19°C): cooling, ice sheets expanded
totrade.co/co2d• Pliocene (~2.6 Mya: ~3.3–3.0 Ma: ~400 ppm, ≈16–17°C): ice ages began, humans evolved
totrade.co/co2e• Holocene (11.7 kya: 422 ppm, ≈14.0–14.5°C): stability enabled rise/fall of Empires
totrade.co/co2f• Roman Empire (~250 BC–AD 400: 400 ppm, ≈15–17°C): warmest period of the last 2,000 years
totrade.co/co2g• Modern Period (industrial to today: 422 ppm, ≈14.75–13.85°C): cooling trend, full CO₂ & warming scares
totrade.co/hs, but ignore Cataclysm,
totrade.co/ct
The lesson: climate is never static. Life adapts, but rapid change by Cataclysm;
totrade.co/ct, not by Anthropogenic CO₂
totrade.co/hs, just like the past before Human, threatens our food, energy, water, infrastructure, technology... and future.
Business Plan:
totrade.co/bpMMCO: Middle Miocene Climatic Optimum
=====END LinkedIn Comment Version=====
=====Facebook Version=====
It seems the warmth of our world—so often cursed—is in fact the cradle of life itself. Photosynthesis thrives under golden rays, ecosystems bloom, and civilizations flourish. Yet, as we drift toward a colder fate—yes, colder, as the data warns and the currents shift—you may soon find yourself longing for the very heat you once feared. When frost bites the fields and silence falls over once-lush lands, you will pray for the sun. And then, perhaps, you’ll understand: ignorance is not bliss—it’s a slow, shivering descent into regret.
Keys Atmospheric Surface Temperature and CO₂ fluctuations
Life on Earth has responded to varying levels of CO₂ and temperatures over millions of years. Here's a brief overview of each:
1.
Cambrian Explosion: Around 541 million years ago, CO₂ levels were extremely high, estimated at about 7,000 ppm. This period saw a significant increase in biodiversity, with many new types of organisms appearing, particularly in the oceans[1],
totrade.co/co2a
2.
Triassic-Jurassic: Approximately 201 million years ago, CO₂ levels were around 2,200 ppm. This era was marked by the rise of dinosaurs and the extinction of many other species, likely due to volcanic activity and climate changes[2],
totrade.co/co2b
3.
Palaeocene-Eocene Thermal Maximum (PETM): About 56 million years ago, CO₂ levels were around 1,800 ppm. This period experienced a rapid temperature increase, leading to significant changes in ecosystems and the extinction of some species, while others adapted or migrated[3],
totrade.co/co2c
4.
Middle Miocene Disruption: Around 14 million years ago, CO₂ levels dropped to about 600 ppm. This period saw a cooling trend and the expansion of ice sheets, which led to changes in habitats and the extinction of some species[4],
totrade.co/co2d
5.
End of the Pliocene: About 2.6 million years ago, CO₂ levels were similar to today's, around 400 ppm. This period marked the beginning of the ice ages, with significant cooling and the spread of grasslands, which influenced the evolution of many species, including early humans[5],
totrade.co/co2e
6. Current Holocene Epoch: Starting around 11,700 years ago, after the last cataclysmic event, the Holocene is characterized by relatively stable climate conditions. The current average temperature is about 14.00°C, with CO₂ levels at approximately 422 ppm. This period has seen the development of human civilizations and significant changes in land use and ecosystems.
7. From The Roman Empire:
‘’The greatest time of the Roman Empire coincided with the warmest period of the last 2,000 years in the Mediterranean, according to a study published in the journal Scientific Reports’’, totrade.co/co2gThese periods illustrate the dynamic nature of Earth's climate and the resilience of life in adapting to these changes. The rapid increase in CO₂ levels and temperatures in recent times, however, poses unprecedented challenges for modern ecosystems and human societies.
[1] Columbia University: Dinosaurs survived when CO₂ was extremely high, why can't humans:
totrade.co/co2a PHYS: Dinosaurs survived CO₂ extremely high:
totrade.co/co2b[3] Oxygen and CO₂ level during Mesozoic Jurassic-Triassic Cretaceous:
totrade.co/co2c[4] Middle Miocene disruption:
totrade.co/co2d[5] Middle Miocene Climate Optimum:
totrade.co/co2e[6] What Pliocene Epoch Teach us about future warming Earth:
totrade.co/co2f[7] From The Roman Empire: Warm during the Rise of Roman Empire:
totrade.co/co2g
To avoid displaying 46km in length, each graph X-Axis has variable scale:
-
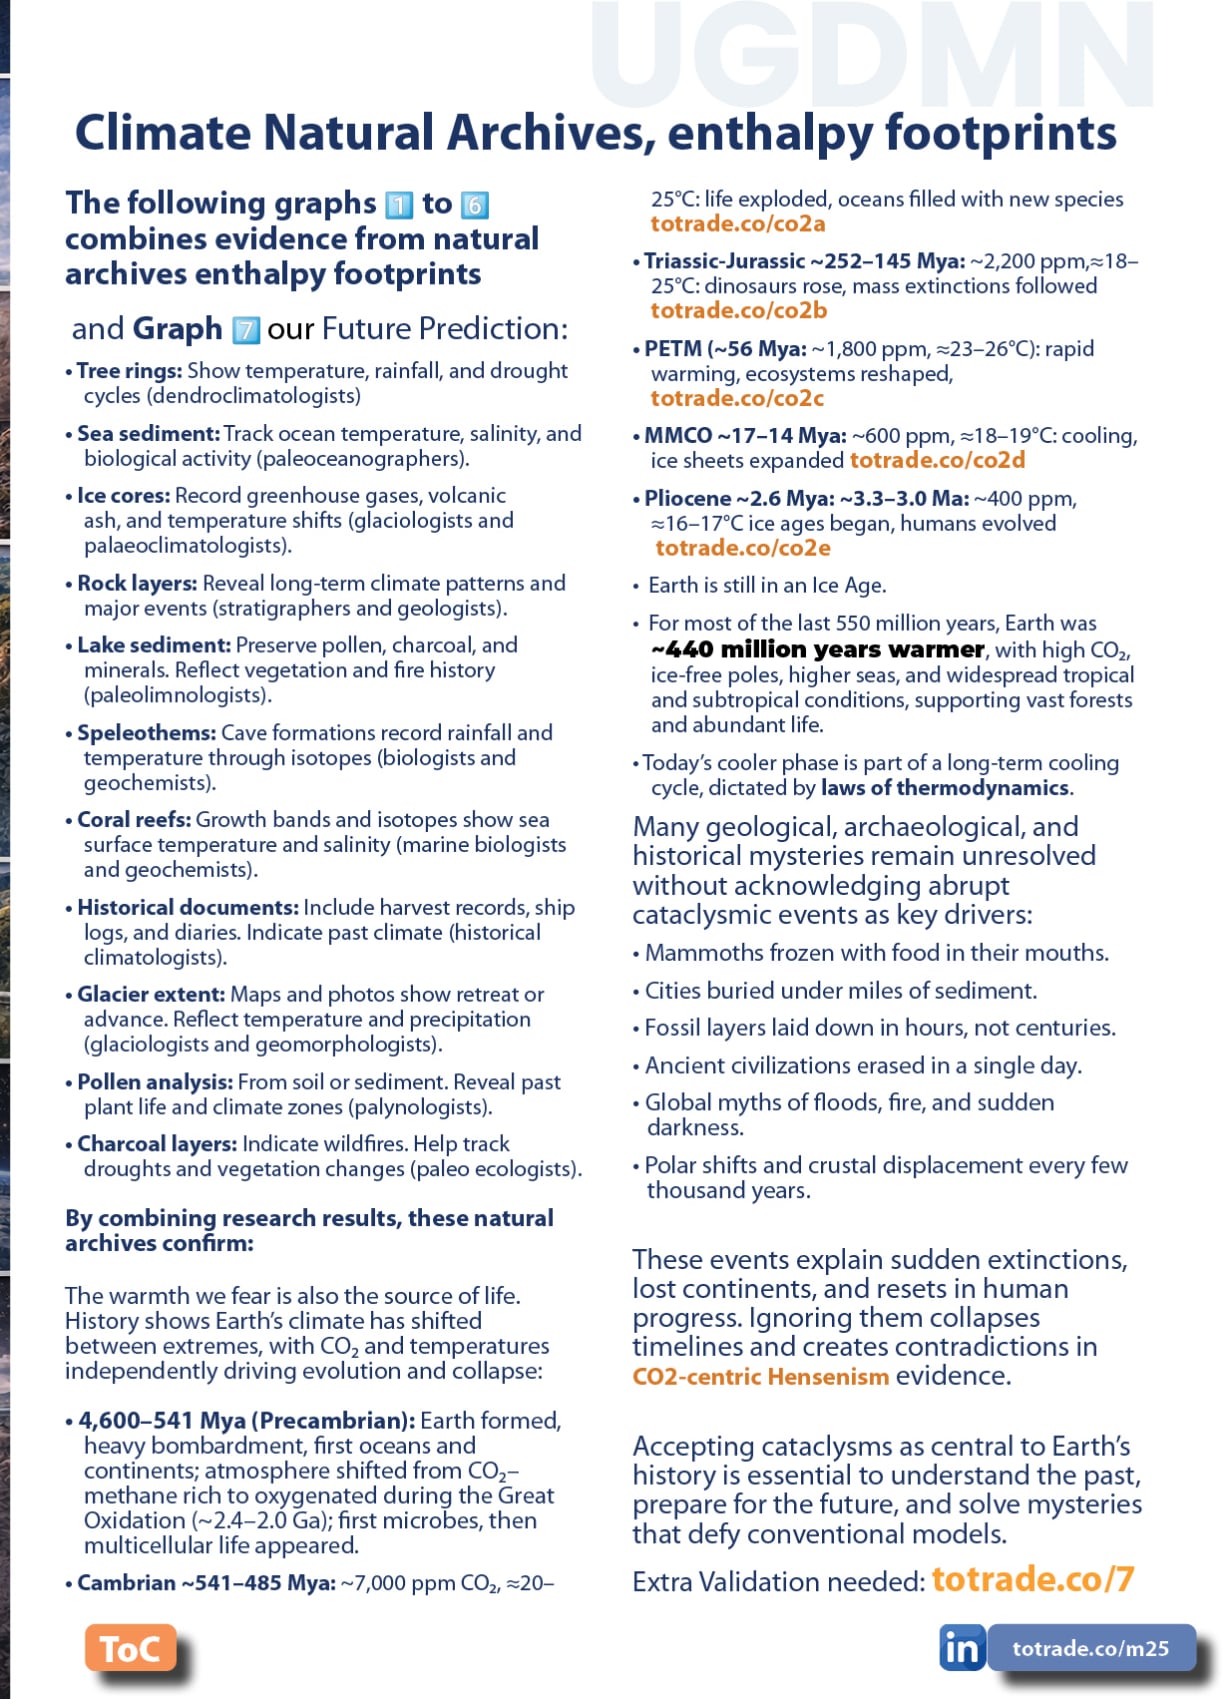
Graph 1: the entire Earth Geological Timescale
• 4,600–541 Mya (Precambrian): Earth formed, heavy bombardment, first oceans and continents; atmosphere shifted from CO₂–methane rich to oxygenated during the Great Oxidation (~2.4–2.0 Ga); first microbes, then multicellular life appeared.
• Cambrian ~541–485 Mya: ~7,000 ppm CO₂, ≈20–25°C: life exploded, oceans filled with new species
totrade.co/co2a• Triassic-Jurassic ~252–145 Mya: ~2,200 ppm,≈18–25°C: dinosaurs rose, mass extinctions followed
totrade.co/co2b• PETM (~56 Mya: ~1,800 ppm, ≈23–26°C): rapid warming, ecosystems reshaped,
totrade.co/co2c• MMCO ~17–14 Mya: ~600 ppm, ≈18–19°C: cooling, ice sheets expanded
totrade.co/co2d• Pliocene ~2.6 Mya: ~3.3–3.0 Ma: ~400 ppm, ≈16–17°C ice ages began, humans evolved
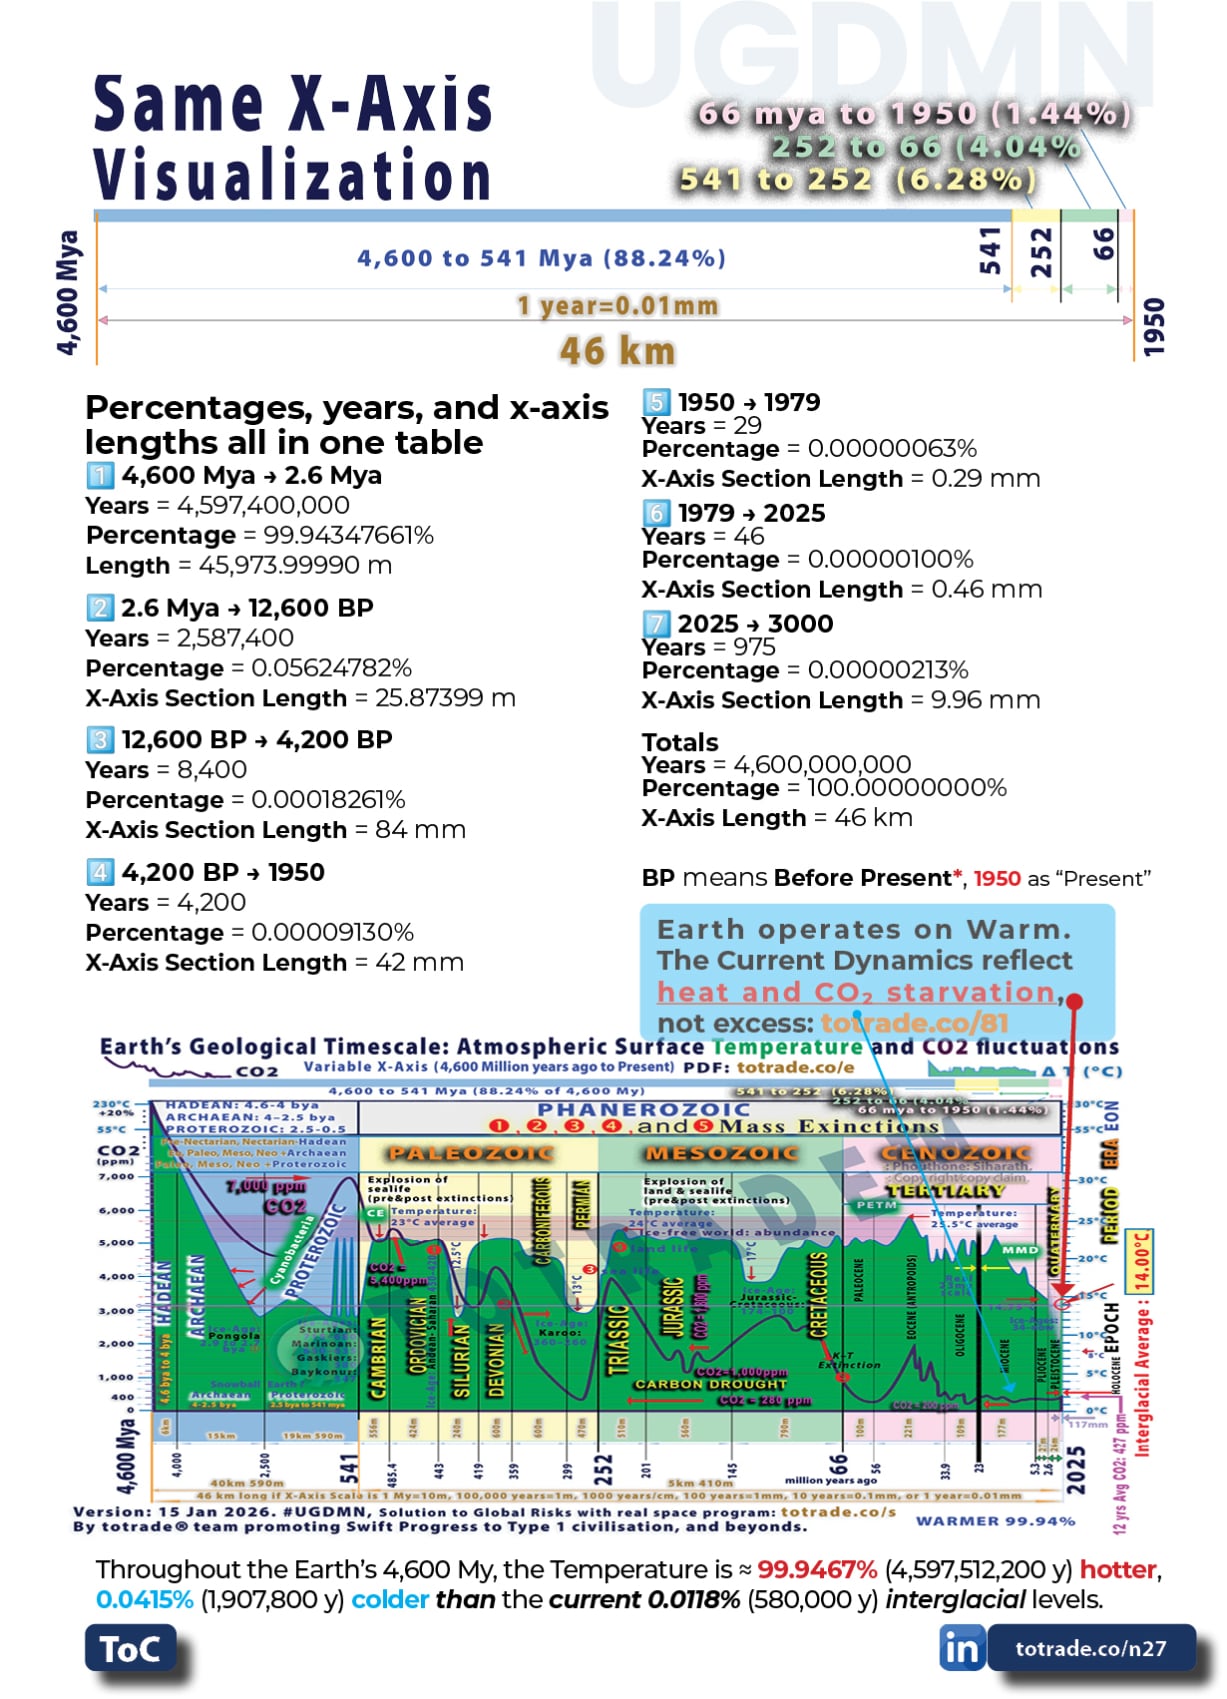
totrade.co/co2eglobal temperature, CO₂ , and sea level (LIE – likely “Lower Ice Extent” / ice volume proxy) between 2.6 million years ago (start of the Quaternary) and 12,600 years before present (end of the last Ice Age):
2.6–1.8 Mya (Early Pleistocene)
• Temperature: Slightly cooler than late Pliocene, with glacial-interglacial cycles starting to appear, ~2–4°C below pre-industrial average during glacials.
• CO₂ : ~260–280 ppm, fluctuating with early glacial cycles.
• Ice volume / LIE: Northern Hemisphere ice sheets modest, smaller than late Pleistocene; sea level ~20–40 m below modern during glacials.
1.8–0.8 Mya (Mid-Pleistocene, 41kyr cycles)
• Temperature: Glacial-interglacial swings amplified; glacials ~5–6°C colder than today, interglacials near modern.
• CO₂ : ~180–280 ppm, closely linked to ice volume.
• Ice volume / LIE: NH ice sheets expanded significantly in glacials; sea level ~50–80 m lower than today.
0.8–0.126 Mya (Late Pleistocene, 100kyr cycles)
• Temperature: Strong 100kyr glacial cycles; Last Glacial Maximum (LGM, ~21kya) ~6–8°C colder globally than today.
• CO₂ : ~180 ppm during glacials, ~280–300 ppm during interglacials; sharp rise at deglaciations.
• Ice volume / LIE: Ice sheets at LGM extended over North America, Europe, and Asia; sea level ~120–130 m below modern.
12,600 BP (Younger Dryas / end of last glacial)
• Temperature: Abrupt cooling during Younger Dryas (~12.9–11.7kya), ~4–5°C below Holocene average.
• CO₂ : ~260 ppm, rising from glacial low (~180 ppm) to early Holocene ~280 ppm.
• Ice volume / LIE: Ice sheets retreating; sea level ~60–70 m below modern, rising rapidly as deglaciation progressed.
Key patterns:
• For most of the last 550 million years, Earth was ~440 million years warmer than “last year”, high CO₂, ice-free poles, higher seas, and widespread tropical and subtropical conditions.
• CO₂ and temperature sharp rises and falls closely link to cataclysms.
• Ice volume (LIE) lags slightly behind temperature/CO₂ during post-cataclysm.
• Glacial periods dominate early and late Pleistocene, representing just ~0.022% of Earth’s 4600My history with interglacials warmer but brief.
Throughout the Earth’s 4,600 My, the Temperature is ≈ 99.9467% (4,597,512,200 y) hotter than the current 0.0118% (580,000 y) interglacial levels. High temperature and CO₂, ice-free poles, higher seas, and widespread tropical and subtropical conditions, support vast forests and abundant life.
And 0.0415% (1,907,800 y) colder with extensive ice sheets. Lower temperature and CO₂, lower sea levels, limited vegetation, and harsh conditions restrict life mostly to refugia and near-equatorial regions.
If the current level were hotter like ≈ 99.9467%, the planet would have high CO₂, ice-free poles, higher seas, plenty of freshwater, and widespread tropical and subtropical conditions, supporting vast forests and abundant life all over the planet.
But the cataclysm will still strike, reshaping climates, seas, and ecosystems, and challenging the survival of civilizations,
totrade.co/ct
-
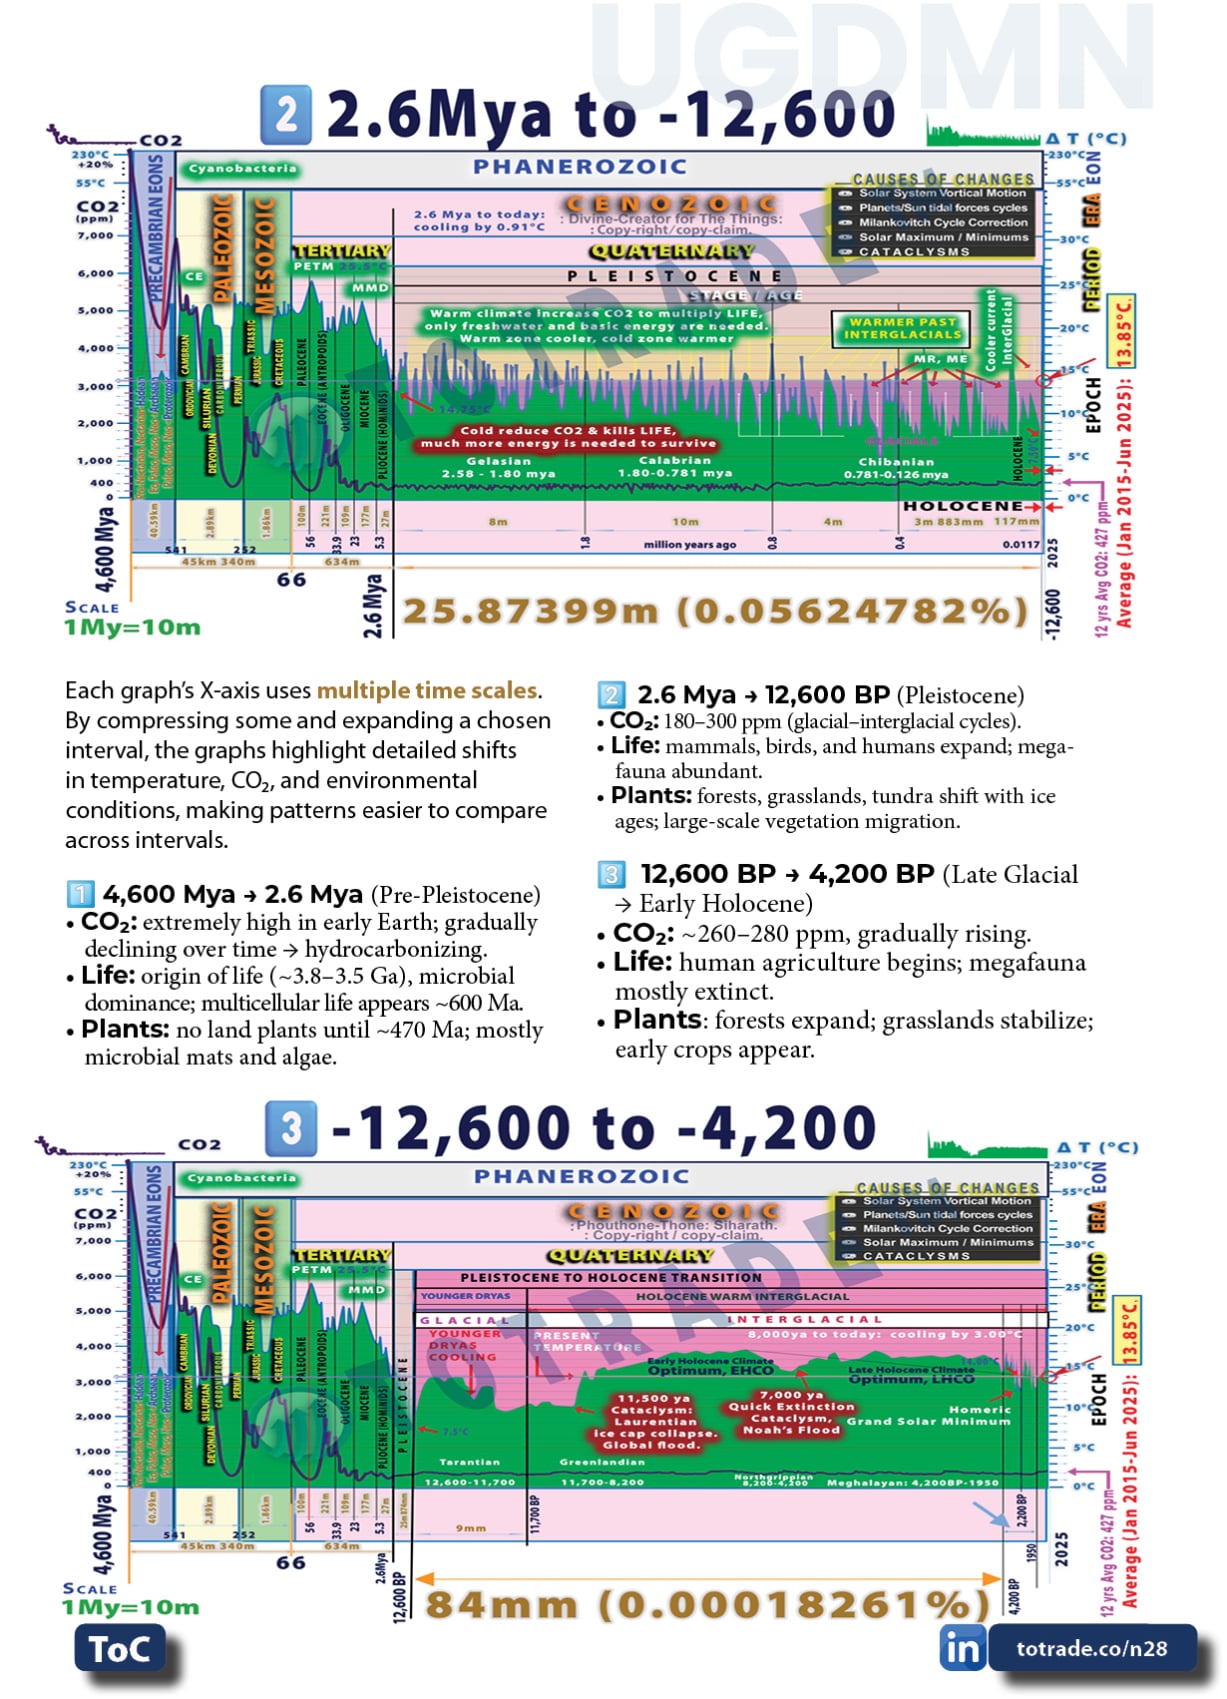
Graph 3: The Pleistocene to Holocene Transition
Between 12,600 BP and 11,700 BP, Earth was in the Younger Dryas, a sudden return to near-glacial conditions after initial warming.
• Temperatures in the North Atlantic and Europe dropped by about 4–10 °C within decades.
• Ice sheets stabilized or re-advanced in some regions.
• Cold, dry conditions reduced forests and expanded tundra.
• Ocean circulation weakened, likely from meltwater disrupting the Atlantic overturning system.
• This cold phase ended abruptly around 11,700 BP, marking the start of the Holocene.
Between 11,700 BP and 7,000 BP, Earth transitioned from the last Ice Age into the early Holocene.
• Temperatures rose sharply around 11,500 BP by Cataclysm, ending the Younger Dryas cold phase. • By 10,000 BP, global climate was close to modern warmth.
• Glaciers retreated rapidly, and sea levels rose about 20 meters during this span.
• Regional climates varied: some areas warmed quickly, others more gradually.
Between 7,000 BP and 4,200 BP, Earth’s climate was in the Holocene Climate Optimum (HCO).
• Triggered by
Noah Flood Cataclysm, global temperatures were warmer than today by about 0.5–2 °C, depending on the region.
• Northern Hemisphere summers were especially warm due to stronger orbital forcing.
• Forests expanded into areas that are now tundra.
• Monsoon systems in Africa and Asia were stronger, creating greener Sahara conditions.
-
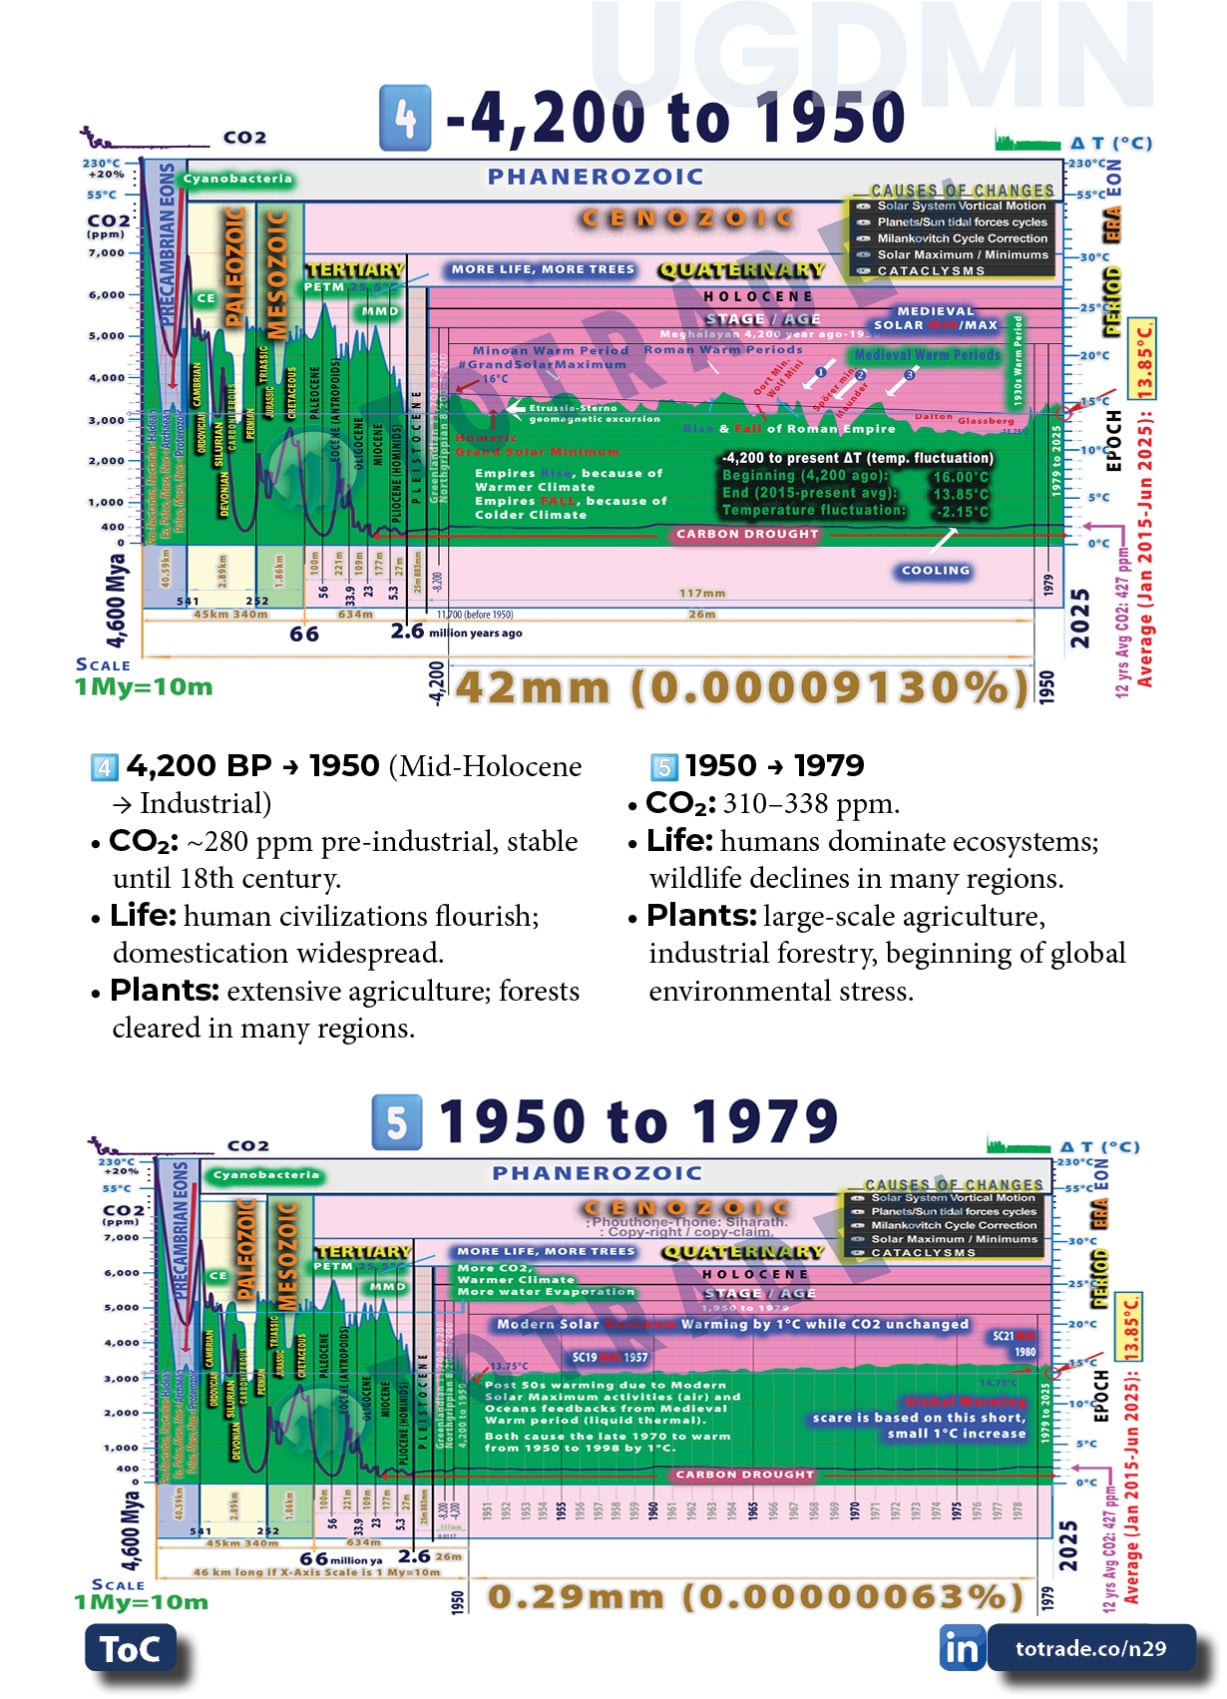
Graph 4: The Holocene from 4,200 years before 1950 to 1950
From 4,200 BP to 1950, Earth’s climate was within the late Holocene, generally cooler and more variable than the early Holocene.
• Around 4,200 BP, a sharp cooling and drying event struck many regions, linked to collapses in Mesopotamia, Egypt, and the Indus Valley.
• Afterward, global temperatures stayed near or slightly below modern averages, with strong regional fluctuations.
• Warm phases included the Roman Warm Period (~250 BCE–400 CE) and the Medieval Warm Period (~900–1200 CE).
• Cold phases included the Dark Ages Cold Period (~400–800 CE) and the Little Ice Age (~1300–1850 CE), when glaciers expanded, winters lengthened, and famines increased.
• By 1850–1950, temperatures began rising again, marking the shift toward modern warming.
-
Graph 5: 1950 to 1979, The Great Acceleration
The Industrial Revolution, which began in the late 1700s. This period is better described as the post-war industrial boom or the Great Acceleration.
• Global population, energy use, and industrial output surged.
• Fossil fuel burning grew rapidly, increasing CO₂ from ~310 ppm in 1950 to ~337 ppm in 1979.
• Global temperatures were relatively stable, with slight cooling in the 1950s–1970s due to solar activity.
• By the late 1970s, warming signals began to re-emerge as GCRs start to surge, CO₂ kept rising by deglaciation, warming Oceans, and reduced forest trees, and increased buildings and infrastructure.
-
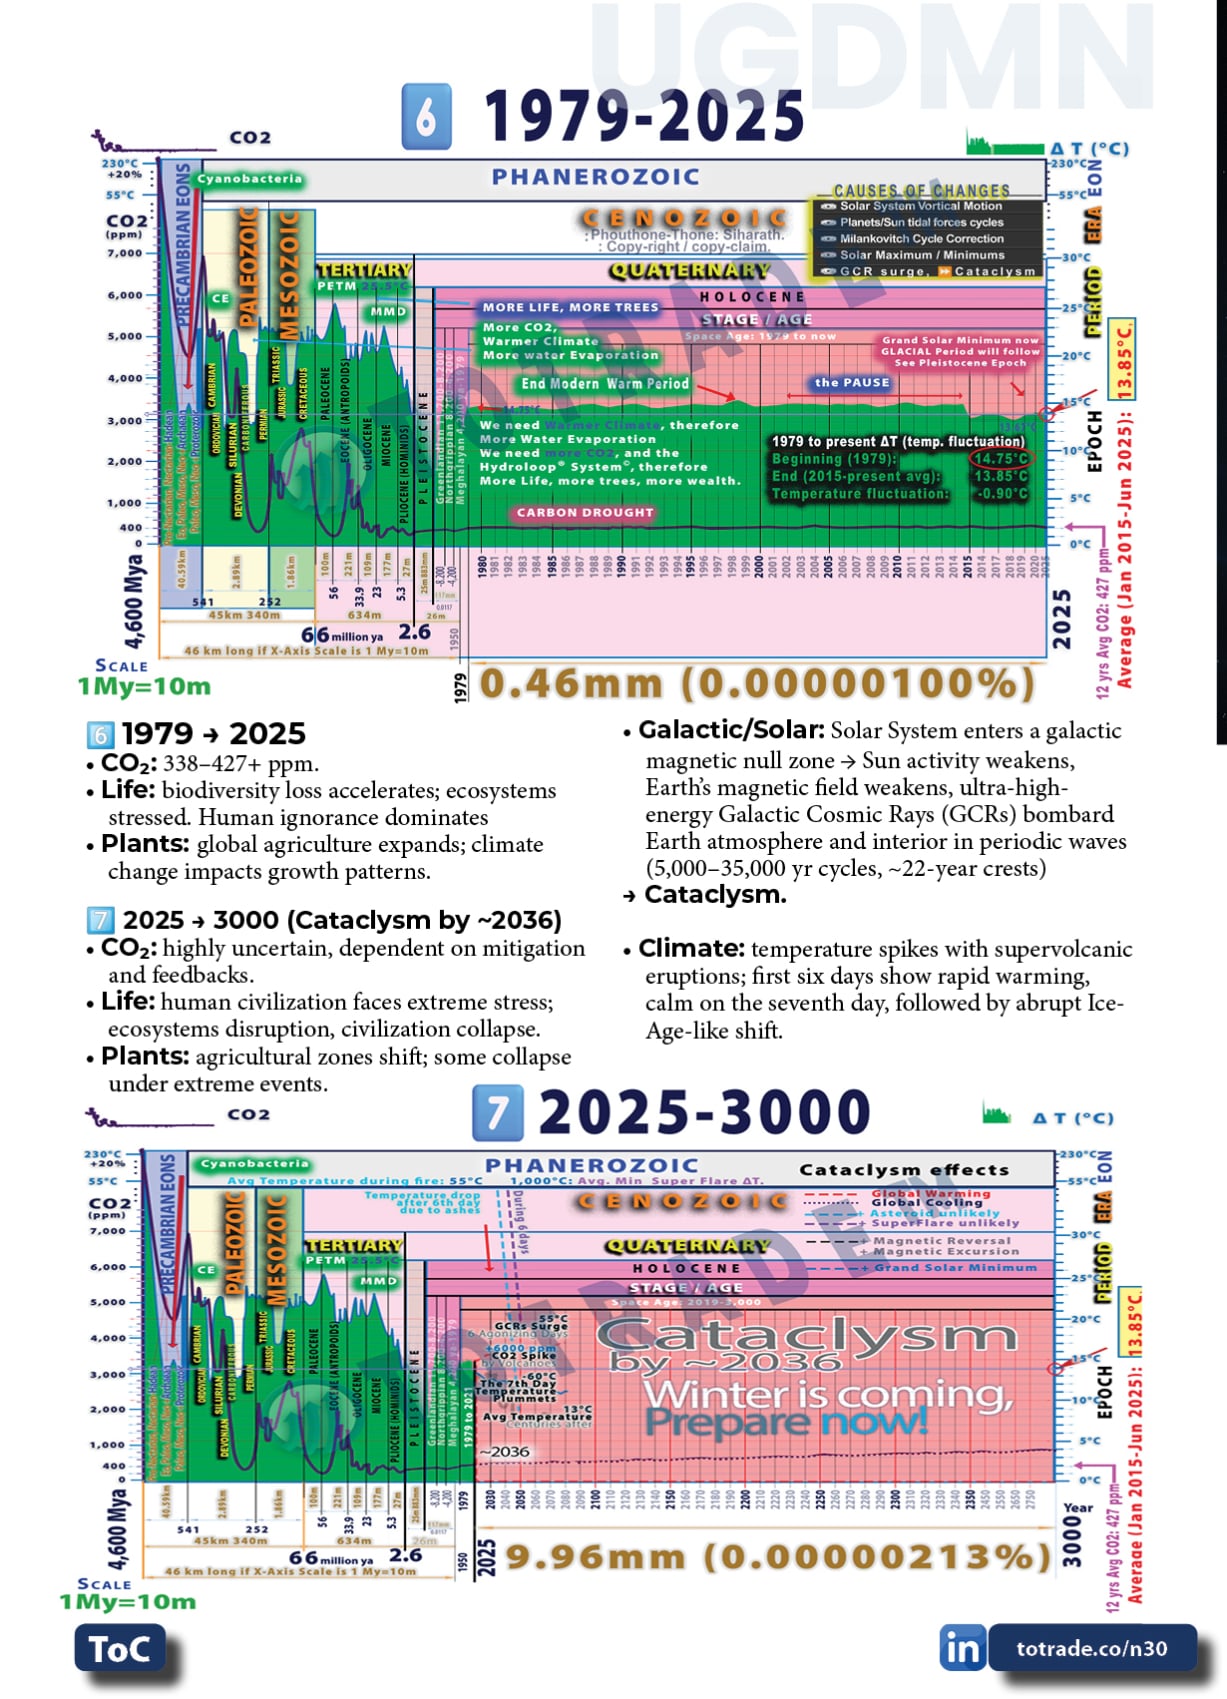
Graph 6: 1979 to 2025 with The Pause (1998-2014),
From 1979 to 2025, Earth entered the strongest warming phase of the Holocene.
• 1979–1997: Steady warming, about 0.15–0.2°C per decade, tied to rising CO₂ due to deglaciations and rising seawater temperature, continuous deforestation, and rapid urbanization.
• 1998–2014: The “Pause” or “Hiatus,” when surface temperature rise slowed, influenced by ocean heat uptake, volcanic aerosols, and a strong 1998 El Niño baseline.
• By 2025: Global temperature is about 1.3–1.4°C above pre-1700s industrial, with some extremes (
heatwaves,
floods,
wildfires) worldwide due to human stupidity.
-
Graph 7: 🌍 Earth on Edge, Toward the Cataclysm (approx. 2036)
#UGDMN view of 2026–3000 with 2036 cataclysm is as follows:
• The cataclysm around 2036 is described as a global reset, triggered by crustal displacement, mega-tsunamis, supersonic winds, and floods. Less than 1% of life survives.
• The event ends the current Arctic Ice Age cycle, melts Greenland and Antarctic ice within ~25 years, and raises sea levels by over 150 meters.
• New polar regions form, while areas like Greenland and Antarctica become tropical. Australia and ASEAN shift into the temperate zone and emerge as sparsely populated centers for renewal.
• Survivors face a new stone-age phase, with little technology, and must rebuild societies from scratch.
• Over centuries, human civilization restarts, as in past cycles (e.g., Noah, Atlantis, Egypt), with myths and fragmented memory of the event shaping culture.
• By 3000, according to our
#UGDMN perspective, humanity either adapts to a reorganized planet with new coastlines, climates, and resource bases—or fails to rebuild, leaving scattered remnants.
This framework suggests that the
#UGDMN mission is to prepare scalable resilience systems (water, food, housing, energy, transport) so that after 2036, survivors can leap forward rather than fall back into millennia of lost progress.
=====END Facebook Version=====